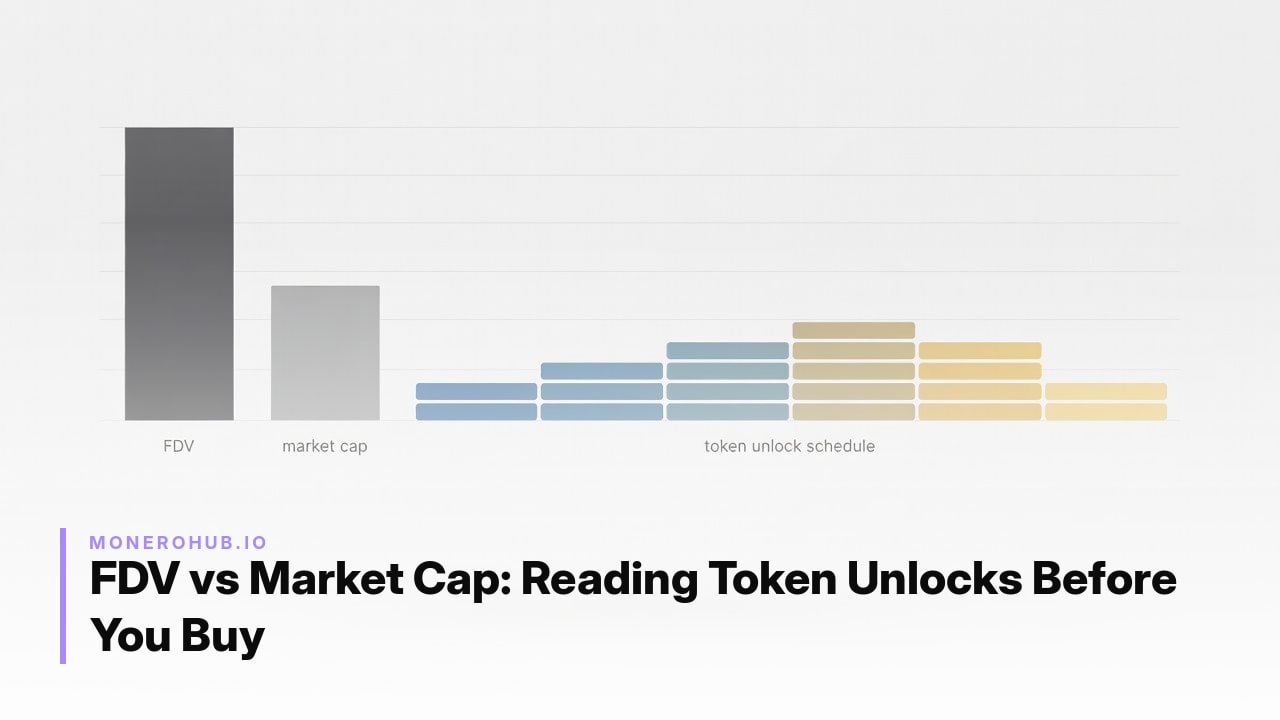
Understand FDV versus market cap differences and how token unlock schedules signal dilution risk before buying crypto assets.
Understanding FDV vs market cap is essential for evaluating dilution risk from token unlocks before buying any crypto asset.
Fully diluted valuation multiplies the current token price by total or maximum supply. Market capitalization multiplies the same price by circulating supply only. The resulting ratio of market cap to FDV therefore indicates what portion of eventual supply already trades openly.
Tokenomist applies maximum supply for capped tokens and a Year-2035 projected supply for uncapped tokens when calculating FDV. It further distinguishes an adjusted market cap that reflects released supply rather than strict circulating figures. CoinGecko uses price times total supply for FDV and publishes the Market Cap / FDV ratio as a core displayed metric.
The numerical gap between FDV and market cap quantifies future dilution risk from locked, vested, or unissued tokens that will enter circulation through unlocks or emissions. High FDV-to-market-cap ratios signal substantial remaining supply that demand must absorb to avoid price pressure. The ratio approaches one as nearly all supply becomes circulating.
Unlocks occur according to predefined vesting schedules that typically feature either cliffs or linear releases. A cliff unlocks a substantial block of tokens in a single event once the vesting period ends. Linear vesting, by contrast, releases smaller amounts at regular intervals, spreading the entry of new supply over months or years.
Locked allocations usually belong to teams, early investors, ecosystem funds, or project treasuries. Until unlocked, these tokens do not contribute to circulating supply. Upon release they move into the open market, expanding the number of tokens available for trading.
This expansion creates dilution pressure because existing holders now share ownership with a larger total float. Price stability depends on new buyers absorbing the additional supply. Without matching demand growth, the influx tends to increase sell orders and depress token value.
High FDV-to-market-cap ratios highlight exactly this risk. They indicate that a large share of total supply still sits in locked form. As those tokens unlock over time, the market must continually absorb them. Ratios close to one reflect a supply profile already largely in circulation, reducing the scope for future dilution events.
DefiLlama data accessed around September 2, 2026 shows upcoming unlocks totaling $187.88 million in the next 7 days, split between $91.57 million in cliffs and $96.31 million in linear releases. The 30-day figure reaches $1.029 billion, with $492.86 million cliff and $536.31 million linear components across 370 tracked protocols.
The following table compares four tokens using the latest reported figures for price, market cap, unlocked percentage, and next unlock size.
| Token | Price | Market Cap | Percent Unlocked | Next Unlock |
|---|---|---|---|---|
| Canton | $0.11 | $4.482 billion | 69.26% | $2.25 million (24h) |
| IOTA | $0.04 | $182.95 million | 87.2% | Not specified |
| MemeCore | $1.06 | $2.402 billion | 19.21% | $59.42 million cliff (24h) |
| ENA | Not specified | Not specified | 65.5% | 275 million tokens (~Sep 1/2) |
Canton’s weekly rate equals 0.38% of float, while MemeCore’s 24-hour cliff represents 2.47% of float. ENA data comes from Tokenomist-linked records showing 9.828 billion tokens circulating out of a 15 billion total supply. These snapshots highlight varying dilution exposure across projects with different unlock cadences.
On August 27, 2026, the Ethena Foundation announced an OTC buyout of locked ENA tokens from major seed investors who had sold any ENA since the October 10, 2025 market peak. The foundation also agreed to release all remaining original investor tokens in a single event beginning October 5, 2026, ending the prior monthly VC unlock cadence. Team tokens stay on their original schedules, leaving roughly 12 percent of supply locked afterward in team, ecosystem, and foundation allocations only. A governance vote was proposed to direct 95 percent of net revenue to ENA buybacks once USDe supply milestones are met, such as the $7.5 billion threshold.
September 2026 schedules include several material cliffs reported around August 31 and September 1. HYPE faces a 9.92 million token cliff valued at approximately $797 million on September 6. SUI has a 13.53 million token cliff worth about $9.73 million on September 1. ENA sees a 40.63 million token cliff estimated at $6.05 million on September 2. These single-day releases contrast with ongoing linear vesting, such as Rain’s $568.96 million schedule spread across the full 30-day window.
Begin by pulling the latest vesting schedule for the token on Tokenomist or DefiLlama. Check the percentage already unlocked and compare it to the listed total or maximum supply to gauge remaining dilution.
Next calculate weekly unlock pressure against current float. For Canton, DefiLlama shows a 24-hour unlock of $2.25 million equating to 0.38 percent of float; for MemeCore the next cliff reaches 2.47 percent of float. Divide the dollar value of scheduled releases by the circulating market cap to obtain the weekly percentage.
Flag large cliffs that exceed one percent of float in a single day, especially when paired with low unlocked supply such as MemeCore’s 19.21 percent. Also examine remaining locked investor allocations; the Ethena update on 27 August 2026 consolidated most seed-investor tokens into one October event while leaving roughly 12 percent of supply still locked to team and foundation wallets.
Cross-reference the FDV-to-market-cap gap with the unlock calendar. When the gap remains wide and a cliff or linear tranche exceeds one percent of float weekly, demand must absorb the new supply without price support. Review the next 30-day total on DefiLlama ($1.029 billion across 370 protocols) to place any single token in context before entry.
FDV vs market cap reveals future dilution from token unlocks. Check vesting schedules on DefiLlama or Tokenomist, calculate weekly unlock pressure as a percentage of float, and avoid large single-day cliffs when the FDV gap remains wide.
FDV equals current token price multiplied by total or maximum supply. For tokens without a cap, Tokenomist uses a Year-2035 projected supply instead.
DefiLlama tracks upcoming unlocks across 370 protocols. Tokenomist supplies detailed vesting schedules and released percentages. CoinGecko and CoinMarketCap display supply classifications that help estimate dilution.
When locked tokens enter circulation, circulating supply rises. Market cap may shift with price, but the ratio to FDV narrows because more of the total supply is now unlocked and the gap representing future dilution shrinks.
CoinMarketCap often uses total supply without projections and emphasizes circulating market cap for rankings. Tokenomist applies Year-2035 projections for uncapped tokens and reports an adjusted market cap based on released supply.
Tokenomist models a 2035 supply projection that accounts for staking rewards and burns. Other sources may simply omit FDV or rely on total supply when no hard maximum exists.
CoinMarketCap focuses on supply classifications. DefiLlama lists specific cliff and linear releases with dollar values, such as the $1.029 billion scheduled across the next 30 days as of early September 2026.