Master RSI overbought and oversold signals in crypto by understanding its formula, limitations in volatile markets, and practical filters that reduce false trades.
Mastering overbought vs oversold signals with the RSI indicator lets crypto traders avoid common pitfalls when applying the relative strength index to assets like Monero.
The Relative Strength Index uses a 14-period lookback, the default Wilder established in 1978. Calculation begins by separating each period’s price change into either a gain or a loss. Gains are recorded as positive numbers; losses are recorded as positive numbers as well, then treated as negative for the ratio.
Next, compute the average gain and average loss across the first 14 periods. These simple averages form the initial RS value: RS equals average gain divided by average loss. The RSI formula then converts that ratio into the familiar 0–100 scale with the expression 100 minus 100 divided by 1 plus RS.
From the fifteenth period onward, the averages are smoothed rather than recalculated from scratch. Each new average gain is formed by multiplying the prior average gain by 13, adding the current period’s gain, and dividing the result by 14. The same smoothing applies to losses. This produces a running RS that feeds into the same 100 – (100 / (1 + RS)) step on every bar.
Because the formula normalizes momentum to a fixed scale, readings above 70 or below 30 emerge directly from sustained runs of gains or losses. The 14-period default remains unchanged across platforms because it balances responsiveness with stability on the assets Wilder originally tested.
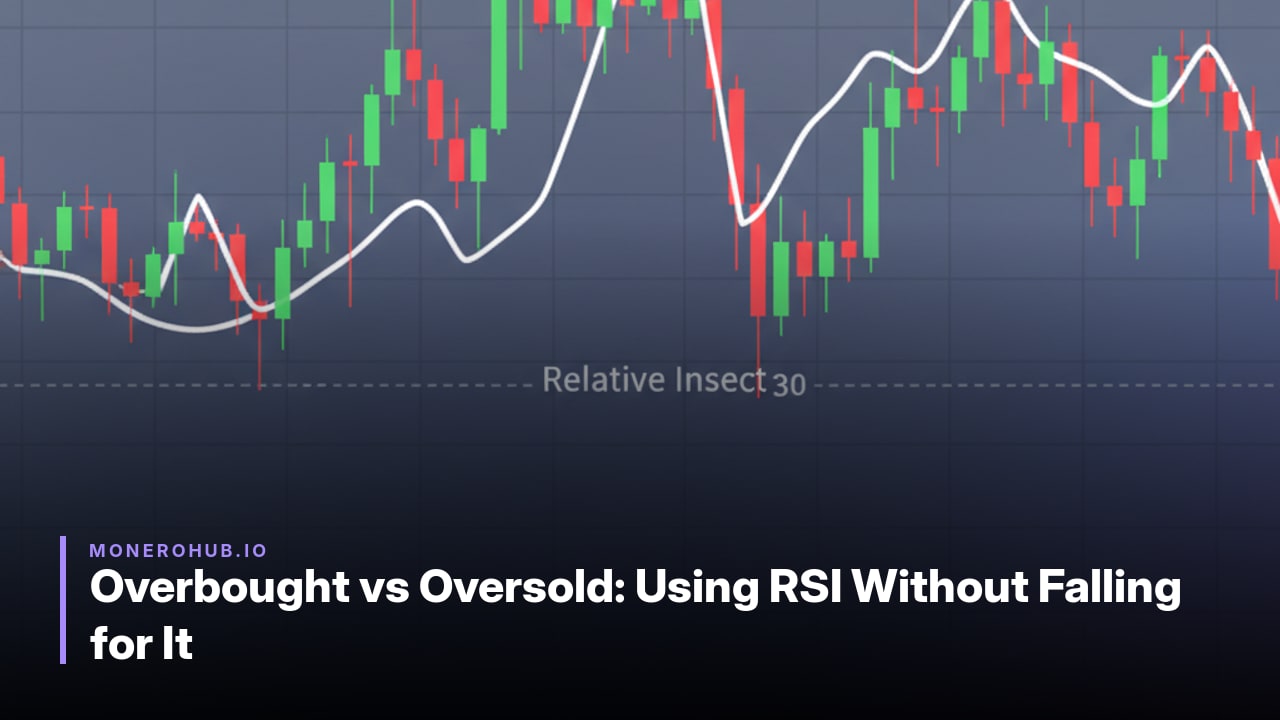
The conventional 70/30 levels define overbought readings above 70 and oversold readings below 30 on the 14-period RSI. These thresholds originated in Wilder’s commodity-market back-tests and remain the platform defaults on TradingView and MetaTrader.
Above 70 the oscillator signals that recent upward price changes have outpaced historical norms, implying momentum exhaustion and a higher probability of reversal or consolidation in sideways conditions. Below 30 the indicator flags excessive downward speed, often preceding a relief rally when buying interest re-enters.
Basic entry logic therefore treats a cross above 70 as a cue to reduce long exposure or initiate shorts, while a cross below 30 prompts longs or short covering. In ranging markets these signals frequently coincide with local tops and bottoms because price reverts once momentum normalizes.
Trending regimes invalidate the same logic. RSI can stay above 70 for weeks without reversal, as documented in the June–July 2025 Nvidia episode where the reading remained elevated while price advanced 13 %. Traders therefore shift thresholds—commonly to 80/20 or 80/40 in strong uptrends and 60/20 in downtrends—to filter noise.
Bull-market RSI typically oscillates between 40 and 90, with the 40–50 zone acting as support, whereas bear markets keep readings between 10 and 60, treating 50–60 as resistance. These regime-adjusted bands replace rigid 70/30 application for more reliable context.
RSI signals show markedly different reliability depending on whether price action is ranging or trending. In sideways conditions the classic 70/30 thresholds frequently coincide with local exhaustion points and subsequent reversals. In strong directional moves, however, readings can remain overbought or oversold for long stretches, producing repeated false signals if the original levels are applied mechanically.
StockCharts analysis notes that bull-market RSI ranges typically fluctuate between roughly 40–90, while bear-market ranges sit between roughly 10–60. These regime-specific bands explain why a 70/30 trigger that works in consolidation often fails during sustained trends.
| Market Regime | RSI Behavior | Signal Characteristics | Typical Outcome |
|---|---|---|---|
| Ranging / sideways | Crosses 70 or 30 at turning points | Reversals align with thresholds | Higher probability of short-term mean reversion |
| Strong uptrend | Stays above 70 for extended periods | Repeated overbought readings without reversal | Early sell signals often incorrect; adjusted 80 level reduces noise |
| Strong downtrend | Stays below 30 for extended periods | Repeated oversold readings without reversal | Early buy signals often incorrect; adjusted 20 level improves timing |
Because exact win rates and holding-period statistics for crypto assets are not quantified in the reviewed sources, traders must treat RSI output as context-dependent rather than absolute. Using an auxiliary trend filter such as ADX helps identify the prevailing regime before acting on any RSI level.
Cryptocurrency markets run nonstop, so price momentum never pauses for weekends or overnight sessions the way it does in equities or forex. This continuous flow lets strong moves extend without the natural cooling periods that reset the 14-period RSI in traditional assets.
Leverage cascades compound the issue. When highly margined positions liquidate in quick succession, prices spike or crash beyond what slower-moving markets experience, pinning RSI above 70 or below 30 for far longer stretches than the month-long overbought episode seen in Nvidia during 2025.
Sudden news shocks, such as exchange outages or regulatory tweets, create abrupt directional thrusts that leave the oscillator in extreme territory until the initial impulse fades. In contrast, the commodity and stock markets Wilder originally tested feature session gaps and lower typical leverage that limit how long readings stay stretched.
Because these forces push RSI into the classic overbought or oversold zones without immediate reversal, the 70/30 thresholds produce more frequent and prolonged false signals than the regime-adjusted behavior observed in equities or forex.
Traders can layer three concrete checks onto raw RSI readings to reduce misleading signals. RSI divergence confirmation, higher-timeframe trend alignment, and a volume spike requirement each address specific weaknesses.
RSI divergence confirmation requires price to print a new high or low while the 14-period RSI fails to follow. This filter improves results near potential reversals by flagging weakening momentum, matching the divergence and failure-swing logic referenced across StockCharts and Investopedia materials.
A higher-timeframe trend filter first verifies the direction on a longer chart. In bull-market ranges where RSI typically fluctuates between roughly 40–90, it prevents counter-trend trades against sustained moves, as shown in the SPY weekly examples through the 2007 period.
The volume spike requirement demands noticeably higher trading volume at the RSI extreme. This filter strengthens signals when participation confirms exhaustion rather than low-volume noise, especially once classic 70/30 thresholds lose reliability in trending conditions.
Each adjustment works best when the market already shows regime uncertainty or mixed momentum; in clear ranging environments the unfiltered 70/30 levels often suffice without added complexity.
The standard 14-period setting comes from Wilder’s original 1978 work and remains the default on most platforms. Many traders shorten it to 7–9 for faster signals on volatile coins, but this increases whipsaws.
Monero’s price action follows the same rules as other assets: in strong trends the indicator can stay above 70 for extended periods without an immediate reversal, exactly as observed in trending equities.
Yes. On-chain data such as exchange inflows or active addresses can confirm whether an overbought reading coincides with distribution, helping filter mechanical signals that fail in bull regimes.
Ignore readings above 70 when the broader trend is strongly upward and the indicator remains in the 40–90 bull-market range; the June–July 2025 Nvidia example showed price continuing to rise while RSI stayed elevated for weeks.
In strong trends many traders shift the levels to 80/20 or 80/40 to cut false signals, following the same regime-based adjustment described in current StockCharts guidance.